Banking & payments
Equity vs KCB: How Kenya's Two Biggest Banks Make Money (H1 2026)
Equity earns 44.5% of income from fees, KCB 68% from interest. How Kenya's biggest banks compare in H1 2026.

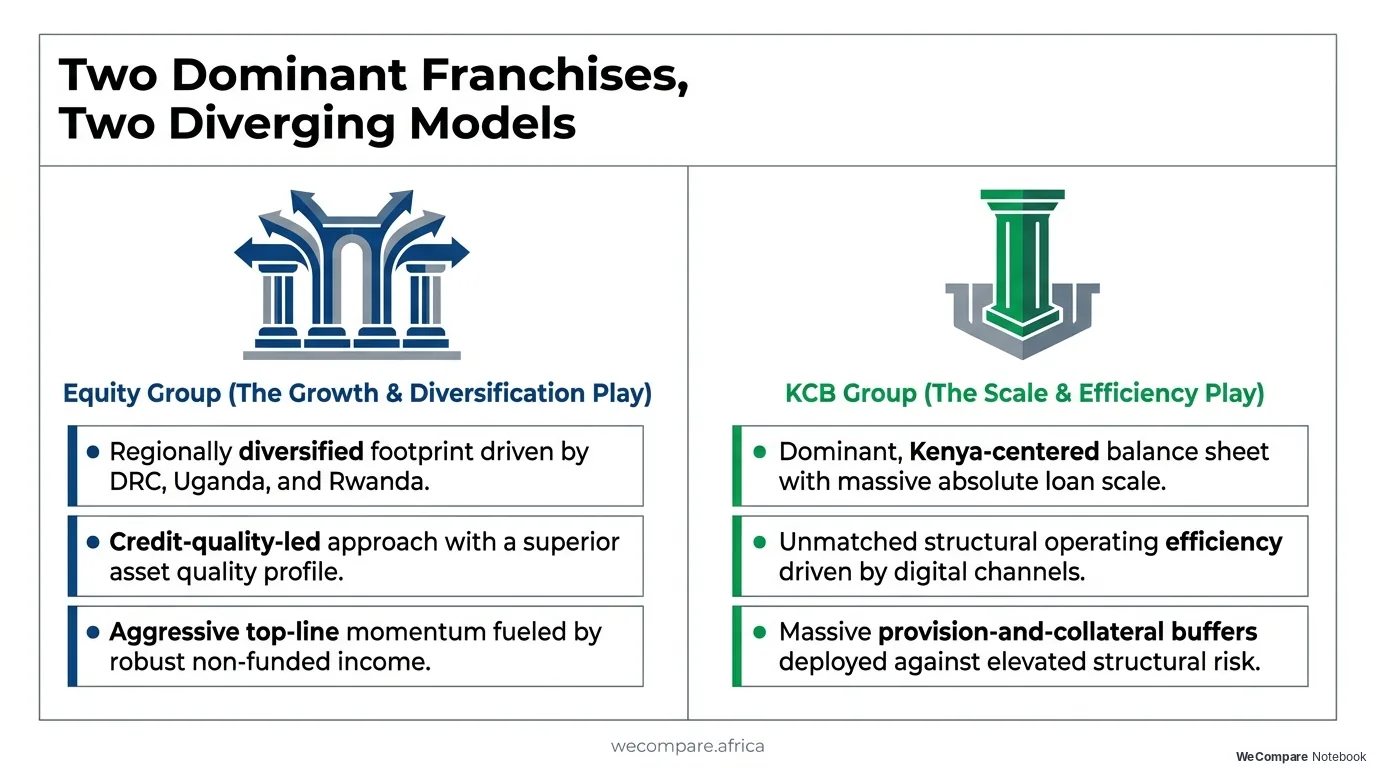
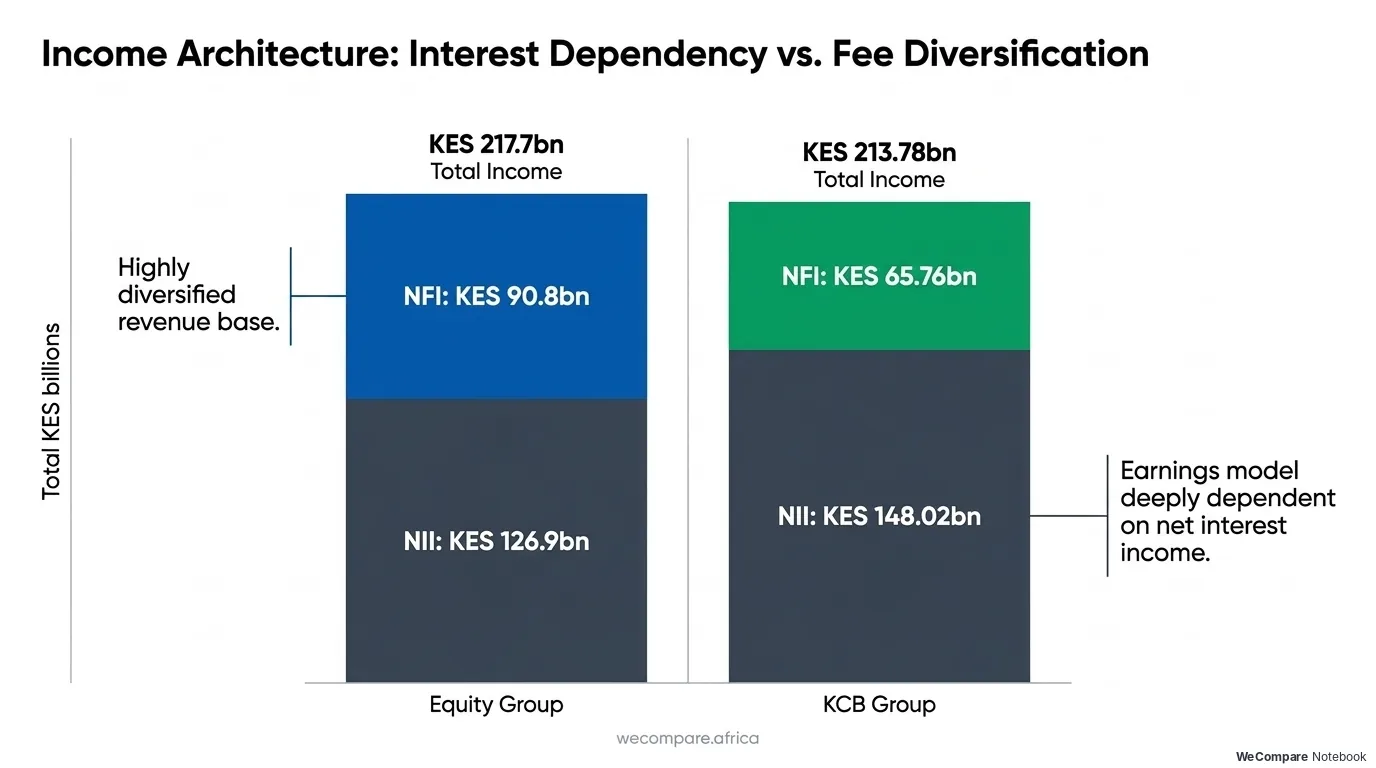
Kenya's two biggest banks now run on opposite models. In FY2025, Equity Group earned KSh 75.5bn after tax, up 55%, and finished ahead of KCB Group at KSh 68.4bn, up 11%, even though KCB has the bigger balance sheet. In H1 2026, Equity earned 44.5% of its income from fees and other non-interest income, while KCB still earned about 68% from interest. That difference decides how each bank copes when the Central Bank of Kenya (CBK) rate is 8.75%.
Biggest banks in Kenya: the short answer
KCB has the bigger balance sheet, with KSh 2.3 trillion in assets against Equity's KSh 2.16 trillion at H1 2026. Equity earns more: KSh 124.9bn in group income against KCB's KSh 108.1bn in the half-year. Together they hold 29.1% of the CBK market-size index.
| H1 2026 | Equity Group | KCB Group |
|---|---|---|
| Total assets | KSh 2.16tn | KSh 2.3tn |
| Total income | KSh 124.9bn (+25%) | KSh 108.1bn (+9.5%) |
| Interest income share | 55% | 68% |
| Non-interest income share | 45% | 32% |
| Cost-to-income | 48.6% | 44.4% |
| Gross NPL ratio | 9.5% | 15.1% |
| Deposits | KSh 1.59tn (+21%) | KSh 1.71tn (+15.1%) |
| Net profit | PAT KSh 45.5bn (+32%) | KSh 36.9bn (+14%) |
The full-year picture: FY2025
The half-year numbers sit on top of a strong 2025 for both banks. The headline is that Equity grew profit five times faster than KCB, and it did so mostly by cutting costs and provisions rather than by lending far more.
| FY2025 | Equity Group | KCB Group |
|---|---|---|
| Profit after tax | KSh 75.5bn (+55%) | KSh 68.4bn (+11%) |
| Total income | KSh 217.7bn (+12.4%) | About KSh 214bn (from KSh 204bn) |
| Total assets | KSh 1.97tn (+9.2%) | About KSh 2.15tn |
| Cost-to-income (excluding provisions) | 51.0% (from 58.2%) | n/a in this comparison |
| Gross NPL ratio | 11.5% (from 13.6%) | See H1 2026 table above |
Three things explain Equity's jump. Net interest income rose 16.8% to KSh 126.9bn as funding costs fell, loan-loss provisions dropped 28% to KSh 14.5bn, and operating expenses fell 5.6%. Non-interest income still supplied about 42% of total income (KSh 90.8bn), and regional subsidiaries contributed roughly half of group profit after tax. Equity's return on average equity reached 27.8%.
KCB's 11% profit growth came from higher lending and revenue, plus regional units, which supplied 30.7% of pre-tax profit in FY2025. About 99% of KCB's transactions now happen outside branches, and it completed the sale of National Bank of Kenya to Access Bank in 2025. KCB proposed a total dividend of KSh 7 a share against Equity's KSh 5.75.
How Equity makes money
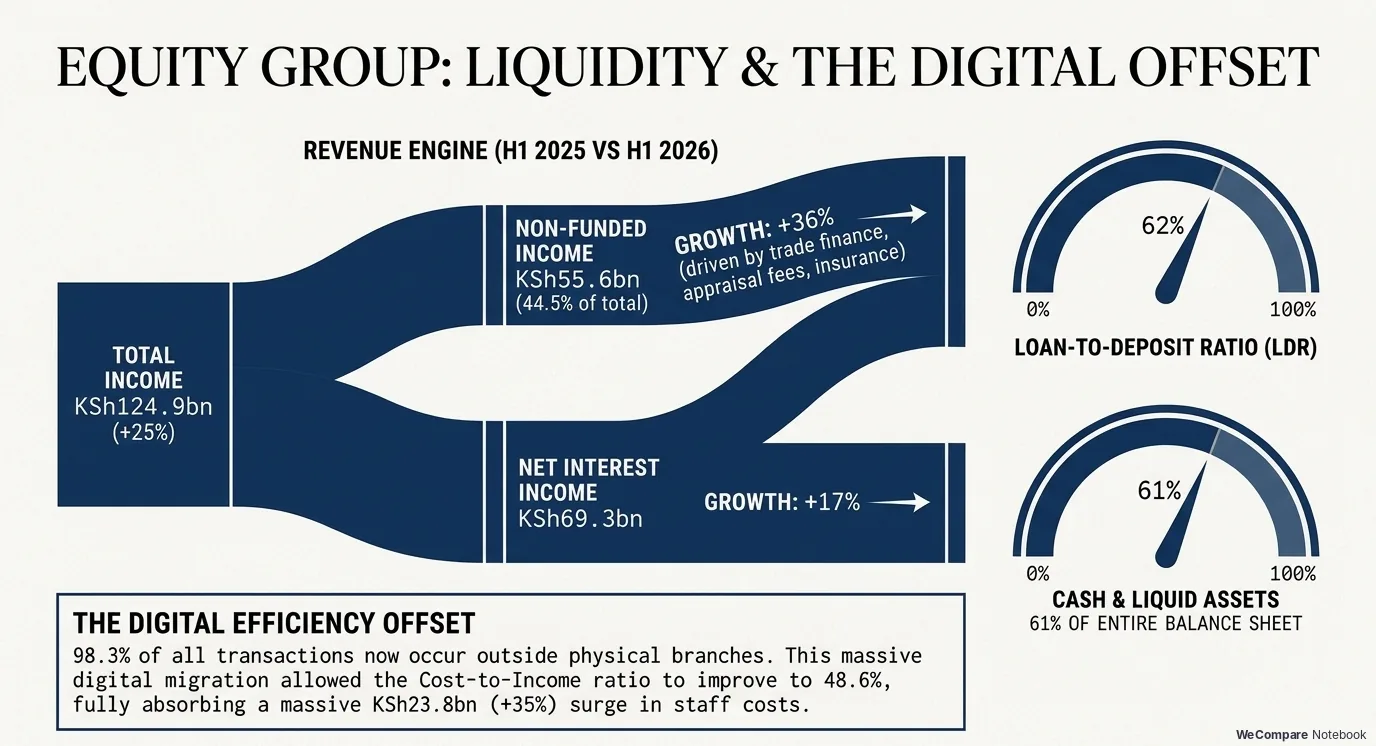
Equity is built around fees and liquidity rather than loans. In H1 2026, non-funded income rose 36% to KSh 55.6bn, driven by trade finance, loan appraisal fees, digital transactions and insurance (gross written premiums +24%, insurance profit +34%).
Its balance sheet is unusually liquid. The loan-to-deposit ratio is 62% and cash and liquid assets are 61% of total assets, so a large part of its interest income comes from government securities, not loans.
Digital is the cost story. About 98.3% of customer transactions happen outside branches and 89.7% of customers are digitally active. That helped cost-to-income improve to 48.6% (from 51.7%), even though staff costs jumped 35% to KSh 23.8bn.
The DRC rumour: half true
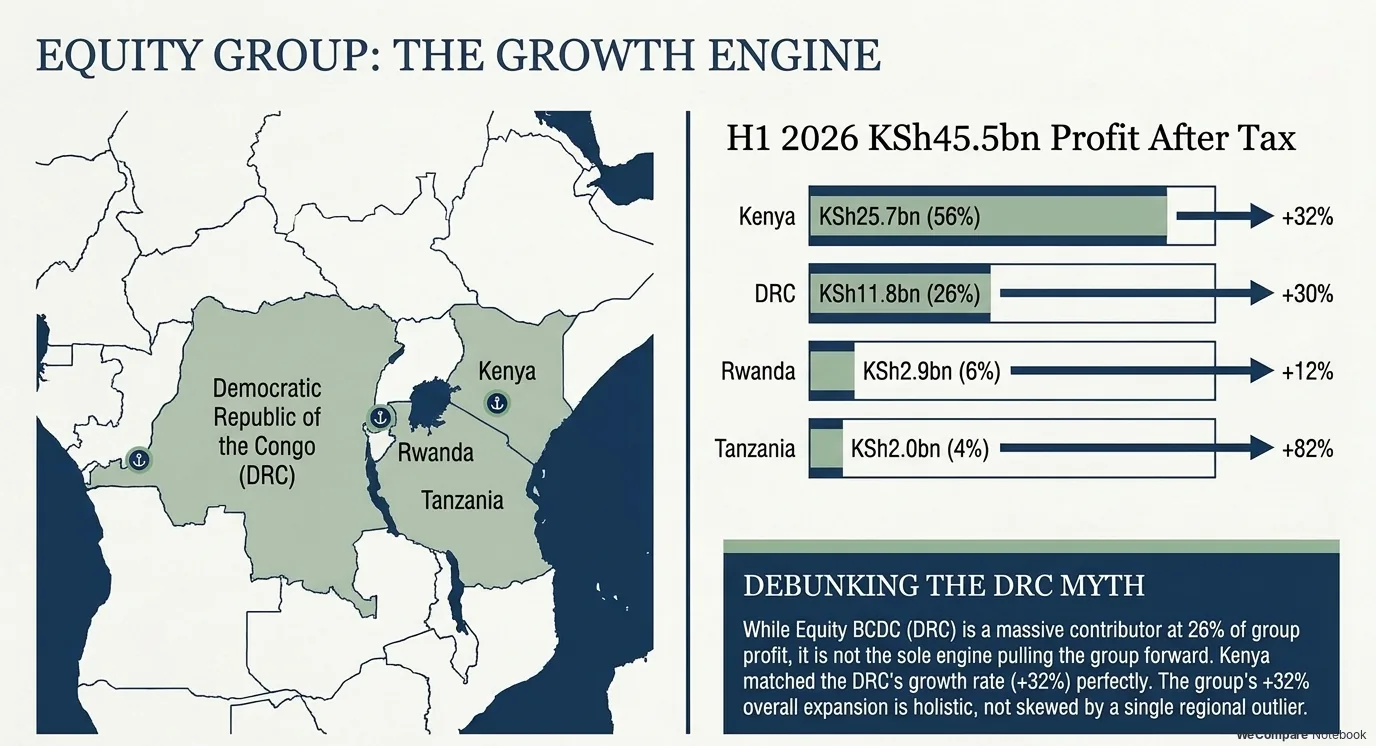
The rumour says Equity's growth depends on the Democratic Republic of Congo (DRC). Half of that is true. Equity BCDC in the DRC earned KSh 11.8bn in profit after tax, about 26% of the group's KSh 45.5bn, and is the biggest regional unit. Across all regions, subsidiaries provide 42% of banking profit, 52% of revenue and 51% of deposits.
The other half is false. Equity Bank Kenya grew 32% to KSh 25.7bn, which matches the group's 32% growth. The DRC unit grew 30%. The DRC is holding its share, not pulling the group along.
| Unit | H1 2026 profit after tax | Growth |
|---|---|---|
| Kenya | KSh 25.7bn | +32% |
| DRC | KSh 11.8bn | +30% |
| Rwanda | KSh 2.9bn | +12% |
| Tanzania | KSh 2.0bn | +82% |
How KCB makes money
KCB is a traditional lender. In H1 2026, net interest income was KSh 74.0bn out of KSh 108.1bn in total income. Its profit before tax rose 20.8% to KSh 49.3bn and net profit rose 14% to KSh 36.9bn, but not from new business lines. It came from three things: cost of funds fell to 3.4% (from 3.9%), operating costs grew only 6%, and loan-loss provisions fell 13.6% to KSh 10.77bn.
Mobile lending is large. KCB disbursed KSh 314bn through mobile loans in H1 2026, roughly KSh 1.7bn a day.
KCB's weak spots
KCB's gross NPL ratio is 15.1%, the highest of the top lenders (industry average 14.8%, CBK, June 2026), though it is down from 18.7% a year earlier. Its tax charge rose 46% to KSh 12.5bn. Regional subsidiaries (led by Tanzania, Uganda and South Sudan) supply about 27% of pre-tax profit in H1 2026 (30.7% in FY2025).
Best bank in Kenya: which bank for which customer?
There is no single best bank in Kenya on these numbers. Each of the two biggest banks is stronger on different measures:
| If you care about | Stronger on the figures | The figures |
|---|---|---|
| Balance sheet size | KCB | Assets KSh 2.3tn (Equity KSh 2.16tn); deposits KSh 1.71tn (Equity KSh 1.59tn), H1 2026 |
| Income and income growth | Equity | H1 2026: KSh 124.9bn (+25%) against KCB's KSh 108.1bn (+9.5%) |
| Full-year profit growth | Equity | FY2025: KSh 75.5bn (+55%) against KCB's KSh 68.4bn (+11%) |
| Fee and digital income | Equity | Non-interest income is 45% of income (KCB 32%); 98.3% of customer transactions outside branches; 89.7% of customers digitally active |
| Interest-led lending | KCB | 68% of income from interest; KSh 314bn of mobile loans disbursed in H1 2026 |
| Cost efficiency | KCB | Cost-to-income 44.4% (Equity 48.6%), H1 2026 |
| Loan book quality | Equity | Gross NPL ratio 9.5% (KCB 15.1%; industry average 14.8%, CBK June 2026) |
Compare the fees and rates on your own account before you choose.
What it means for customers
A bank that lives on fees and digital volume (Equity) tends to push customers to digital channels and charge for transactions. A bank that lives on lending margins (KCB) is more exposed when lending rates fall, as average rates already did, from 17.2% (November 2024) to 14.4% (September 2026, CBK). Compare the fees and rates on your own account, not the bank's size.
Keep reading
- Kenya bank performance H1 2026: the Tier-1 hub analysis
- Best savings accounts in Kenya
- Is Standard Chartered Kenya leaving?
- How I&M Bank Kenya grew deposits 18% with free M-PESA transfers
- CBK rate at 8.75%: what falling interest rates mean for savers and borrowers
Frequently asked questions
Which is bigger, Equity or KCB?
KCB has the bigger balance sheet, with KSh 2.3 trillion in assets against Equity's KSh 2.16 trillion. Equity earns more: KSh 124.9bn in group income against KCB's KSh 108.1bn in H1 2026, and KSh 75.5bn in profit after tax against KCB's KSh 68.4bn for FY2025. Together they hold 29.1% of the CBK market-size index.
How does Equity make money compared with KCB?
Equity earned 44.5% of its H1 2026 income from fees and other non-interest income, driven by trade finance, loan appraisal fees, digital transactions and insurance. KCB still earned about 68% from interest.
Did Equity beat KCB on profit in 2025?
Yes. Equity's profit after tax rose 55% to KSh 75.5bn, while KCB's rose 11% to KSh 68.4bn. Equity's gain came from higher net interest income, 28% lower loan-loss provisions and 5.6% lower operating expenses.
Does Equity's growth depend on the DRC?
Only half. Equity BCDC in the DRC earned KSh 11.8bn in profit after tax, about 26% of the group's KSh 45.5bn. But Equity Bank Kenya grew 32% to KSh 25.7bn, matching the group's 32% growth, while the DRC unit grew 30%.
Which of the two has the weaker loan book?
KCB. Its gross NPL ratio is 15.1%, the highest of the top lenders and above the 14.8% industry average (CBK, June 2026), although it is down from 18.7% a year earlier. Equity's gross NPL ratio is 9.5%.
Which is the best bank in Kenya?
Neither is best on every measure. KCB has the lower cost-to-income ratio (44.4% against 48.6%) and the bigger balance sheet, while Equity has the lower gross NPL ratio (9.5% against 15.1%) and the higher income. Compare the fees and rates on your own account.
Sources
- CBK MPC press release, 7 October 2026
- Equity Group Holdings HY 2026 investor booklet
- KCB Group H1 2026 results: profit before tax rises 20.8% (Biashara Leo)
- KCB Group H1 2026: net profit up 14% to KSh 36.9bn (Business Today)
- Equity Group FY2025 earnings note (Cytonn)
- Equity profit surges to KSh 75.5B as regional units contribute nearly half of earnings (Citizen Digital)
- KCB Group posts 11% net profit to KSh 68.4B (Business Today)
Disclaimer: This article is published for educational, informational and news purposes only. The metrics, ratios and commentary do not constitute investment, tax, legal or financial advice. Consult a licensed financial adviser before making decisions about listed securities.

Join the discussion
Please do not share account numbers, phone numbers, links or other personal details. Comments are general discussion, not advice. All comments are reviewed before they appear, and we may remove comments that break these rules.