Kenya Bank Performance H1 2026: Tier-1 Analysis
How did Kenyan banks perform in H1 2026? Kenya's listed commercial banking sector delivered strong results, with 12 listed lenders generating KES 159.5 billion in post-tax profit. Equity Group Holdings (KES 45.5 billion) and KCB Group (KES 36.9 billion) led the pack. Growth came from non-funded income, digital credit, lower deposit funding costs and cross-border subsidiaries, which cushioned lenders against domestic inflation and elevated industry-wide non-performing loans.
Key takeaways: H1 2026 Kenya Tier-1 banking
- Robust profitability. The 12 listed lenders made a combined KES 159.5 billion post-tax profit, led by Equity (KES 45.5 billion) and KCB (KES 36.9 billion).
- Asset quality decoupling. Tier-1 lenders held NPL ratios at or below the 15.3% industry average, with I&M (8.4%) and Equity (9.5%) in single digits.
- Sovereign paper allocations. Banks capitalised on Treasury bill yields of 8.77%–9.07%; I&M grew government paper holdings 53.4% to KES 204.0 billion.
- Regional subsidiaries drive growth. Equity's regional banking units generated 42% of group profit after tax, anchored by Equity BCDC in the DRC (KES 11.8 billion).
- Strategic consolidation. Nedbank Group secured regulatory clearance to acquire up to 66% of NCBA, prompting pre-deal de-risking (provisions up 60%).
The macro backdrop: growth, inflation and sovereign yields
Kenya's operating environment mixed structural growth with supply-side cost shocks. Real GDP expanded 5.1% year on year in Q2 2026, the fastest second-quarter growth since 2023, anchored by electricity, ICT and transport. Agriculture and tourism were a drag, and imported input costs stayed high on crude oil volatility.
Headline inflation rose to 6.6% in August 2026 from 6.5% in July, almost entirely on non-core items: Irish potatoes +32.7%, tomatoes +29.3%, petrol at KES 226.96 per litre and kerosene at KES 219.87. Core inflation stayed anchored at 3.4%.
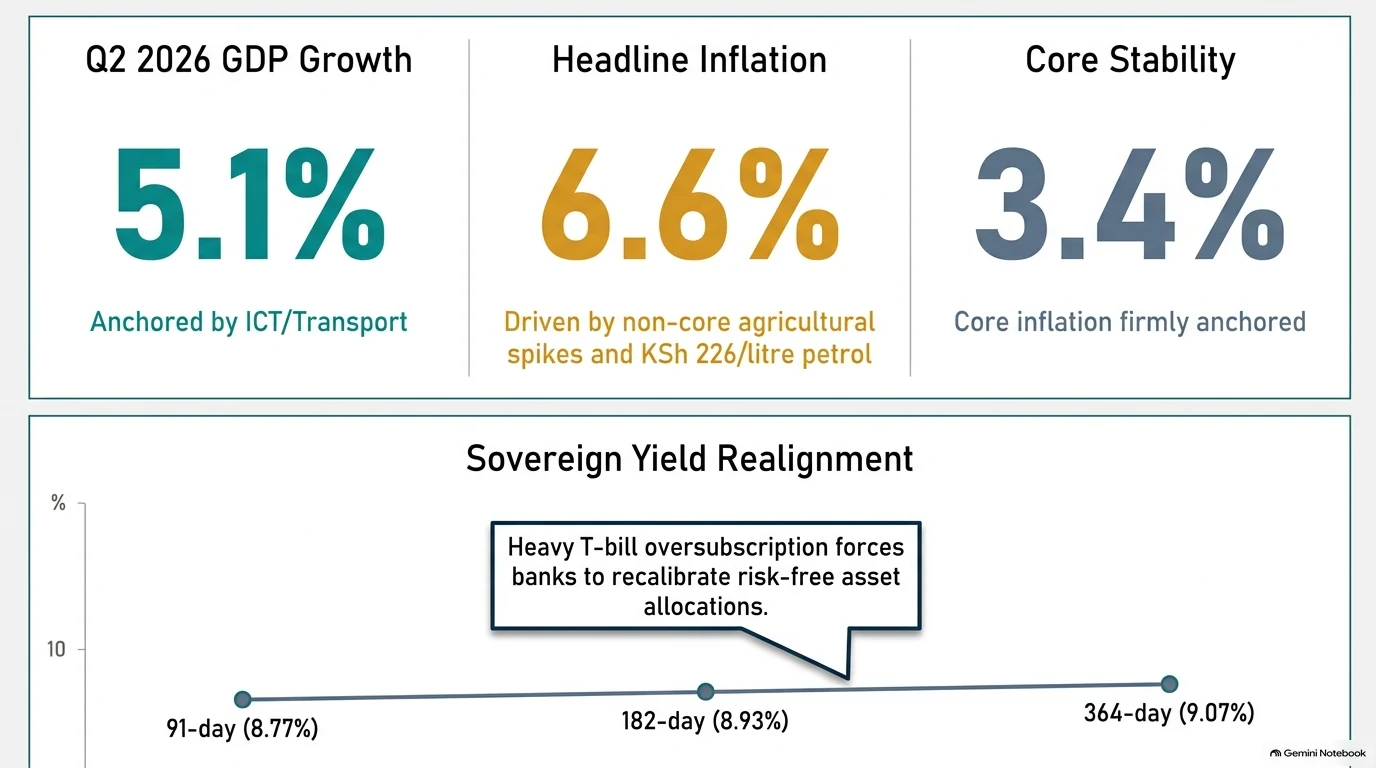
Treasury bills were heavily oversubscribed. At a weekly auction targeting KES 28.0 billion, the Central Bank of Kenya (CBK) accepted KES 51.02 billion, with the 91-day paper alone taking KES 29.2 billion. Short-end yields settled at single digits:
| Treasury bill | Yield |
|---|---|
| 91-day | 8.77% |
| 182-day | 8.93% |
| 364-day | 9.07% |
Elsewhere in the East African Community (EAC), growth projections run ahead of Kenya's 4.5%–5.0%: DRC 5.6%, Tanzania 5.9%, Uganda 6.4%, Rwanda 6.8% and South Sudan 20.0%. That gap is a tailwind for banks with cross-border networks.
So what?
A flat yield curve between 8.77% and 9.07% gave bank treasuries a choice. Lenders that locked in risk-free sovereign paper, such as I&M (government securities up 53.4% to KES 204.0 billion), built predictable interest income while avoiding default risk in volatile domestic segments.
Which Kenyan banks recorded the highest profit in H1 2026?
Equity Group Holdings posted the highest post-tax profit (KES 45.5 billion), followed by KCB Group (KES 36.9 billion). KCB is the largest bank by assets.
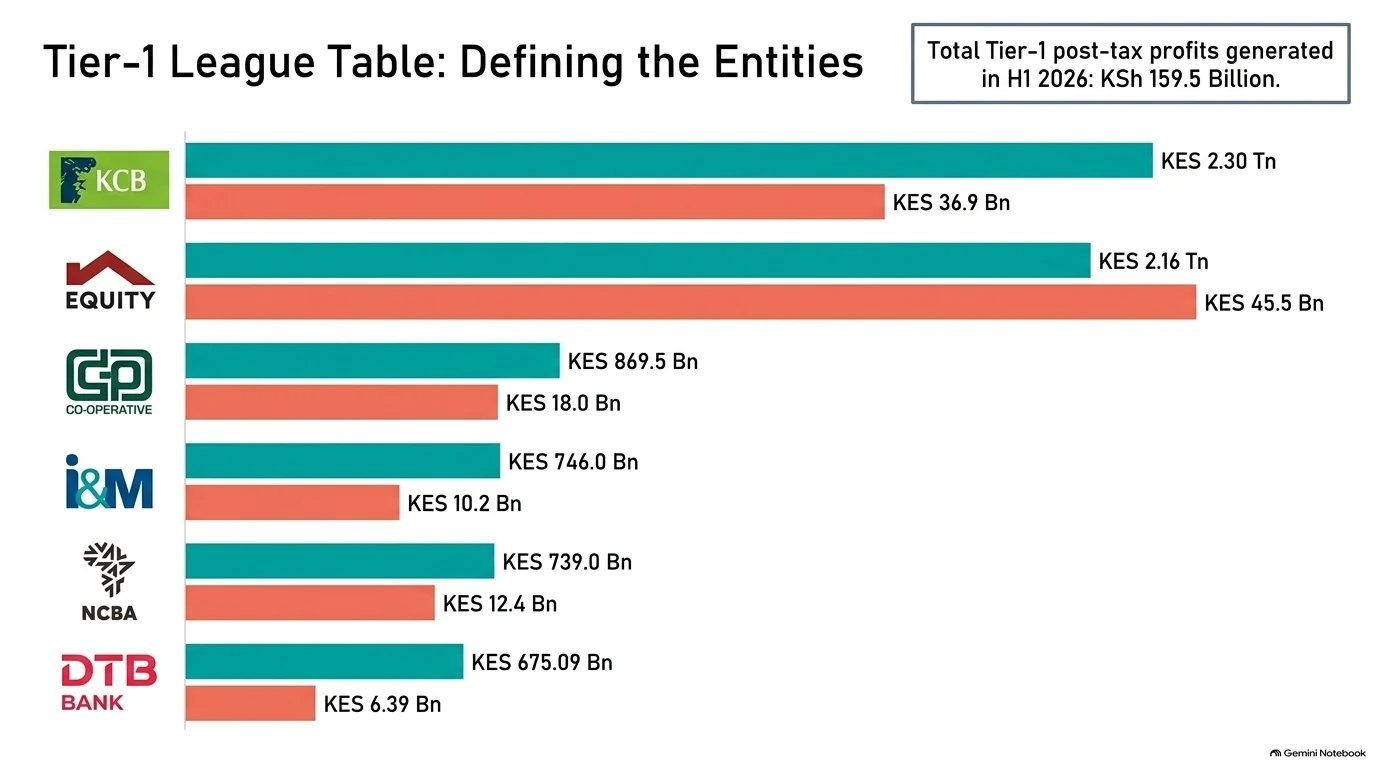
| Bank | Profit before tax | Profit after tax | Total assets | Customer deposits | Loans |
|---|---|---|---|---|---|
| Equity Group | KES 57.8 Bn | KES 45.5 Bn | KES 2.16 Tn | KES 1.59 Tn | KES 981.0 Bn (net) |
| KCB Group | KES 52.8 Bn a | KES 36.9 Bn | KES 2.30 Tn | KES 1.71 Tn | KES 1.30 Tn (gross) |
| Co-operative Bank | KES 23.1 Bn | KES 18.0 Bn | KES 869.5 Bn | KES 623.2 Bn | KES 462.2 Bn (net) |
| NCBA Group | KES 15.5 Bn | KES 12.4 Bn | KES 739.0 Bn | CASA 55% of deposits b | KES 382.0 Bn (gross) |
| I&M Group | KES 13.5 Bn c | KES 10.2 Bn | KES 746.0 Bn | Not specified b | Net loans +15.0% |
| DTB Group | KES 9.84 Bn | KES 6.39 Bn | KES 675.09 Bn | KES 534.15 Bn | KES 357.6 Bn (gross) |
a KCB's profit after tax grew 14.0% against 20.8% growth in profit before tax because of a 46% surge in the effective tax charge. Separate press disclosures put KCB Bank Kenya's pre-tax profit at KES 26.5 billion (+16.0%) and regional subsidiaries at KES 9.52 billion (+10.3%); the summary deck cites regional pre-tax profit of KES 15.0 billion.
b The source decks give no total deposit figure for I&M, and for NCBA only the CASA share.
c I&M's profit after tax grew 22.0% against 15.0% pre-tax growth because its effective tax rate fell from 29.0% to 24.5%.
Equity Group Holdings
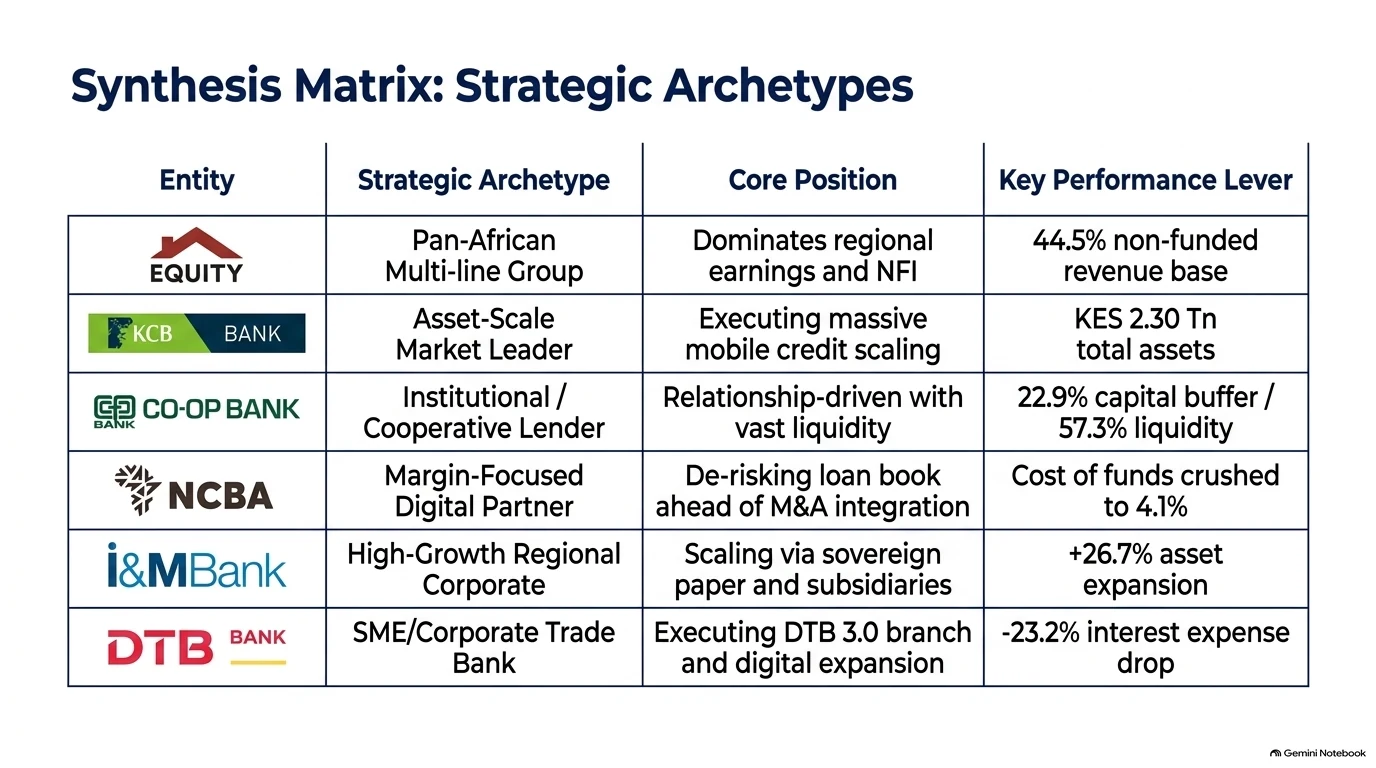
Equity led on earnings power and revenue diversification. Net interest income grew 17.0% to KES 69.3 billion, while non-funded income jumped 36.0% to KES 55.6 billion, lifting its share of group income to 44.5% (from 40.8%). Equity Bank Kenya widened its domestic net interest margin by 110 bps to 8.6% and delivered an annualised domestic ROAE of 34.7%. Equity Insurance Group wrote KES 6.4 billion in gross premiums (+24.0%) and lifted pre-tax profit 34.0% to KES 1.25 billion.
KCB Group
KCB expanded total assets 16.8% to KES 2.30 trillion. Funded income rose 7.0%, cost of funds fell 50 bps to 3.4%, and non-funded income grew 15.4%, anchored by FX trading income (+22.0% to KES 6.35 billion) and KES 314.0 billion of mobile loan disbursements.
Co-operative Bank of Kenya
Co-op delivered low-volatility earnings on total operating income of KES 48.9 billion (+12.5%). Net interest income rose 13.0% to KES 33.2 billion, supported by 18.1% net loan growth to KES 462.2 billion and KES 271.6 billion of government securities. Capital adequacy was 22.9%, liquidity 57.3% and cost-to-income 46.0%.
NCBA Group
NCBA's profit before tax rose 14.3% to KES 15.5 billion and profit after tax 12.2% to KES 12.4 billion. Net interest income surged 20.0% to KES 25.1 billion as cost of funds fell 110 bps to 4.1% and CASA deposits reached 55% of the total. Digital partner platforms (telco ecosystems such as Fuliza and M-Shwari) generated KES 5.0 billion of pre-tax profit (+49.0%), 32% of the group total. Earnings were moderated by a deliberate 60.0% rise in impairment provisions to KES 5.2 billion ahead of the Nedbank deal.
I&M Group
I&M had the fastest balance sheet growth in Tier-1, with assets up 26.7% to KES 746.0 billion. Net interest income grew 22.5% to KES 25.0 billion, helped by a 53.4% surge in government paper holdings to KES 204.0 billion. Non-funded income rose 24.5%, driven by loan fees (+145.8%).
Diamond Trust Bank (DTB)
DTB posted the sector's fastest net interest income growth (+26.4% to KES 20.04 billion). It cut interest expense 23.2% to KES 12.23 billion and raised local-currency deposits to 69% of the total (from 67%). Net interest margin widened 20 bps to 6.8% and cost-to-income improved 640 bps to 46.0%. A 36.5% rise in loan-loss provisions to KES 4.43 billion tempered profit growth.
Tax-adjusted versus operational earnings
- I&M: profit after tax growth (22.0%) outran pre-tax growth (15.0%) because the effective tax rate dropped from 29.0% to 24.5%. Part of the bottom-line acceleration is a tax tailwind, not operations.
- KCB: the opposite. Pre-tax profit grew 20.8% but post-tax profit only 14.0% on the 46% jump in the tax charge, so KCB's operating momentum is stronger than its headline implies.
Balance sheets: how banks allocated capital
Tier-1 lenders made different calls between private-sector credit and risk-free sovereign paper, while competing for low-cost current and savings (CASA) deposits.
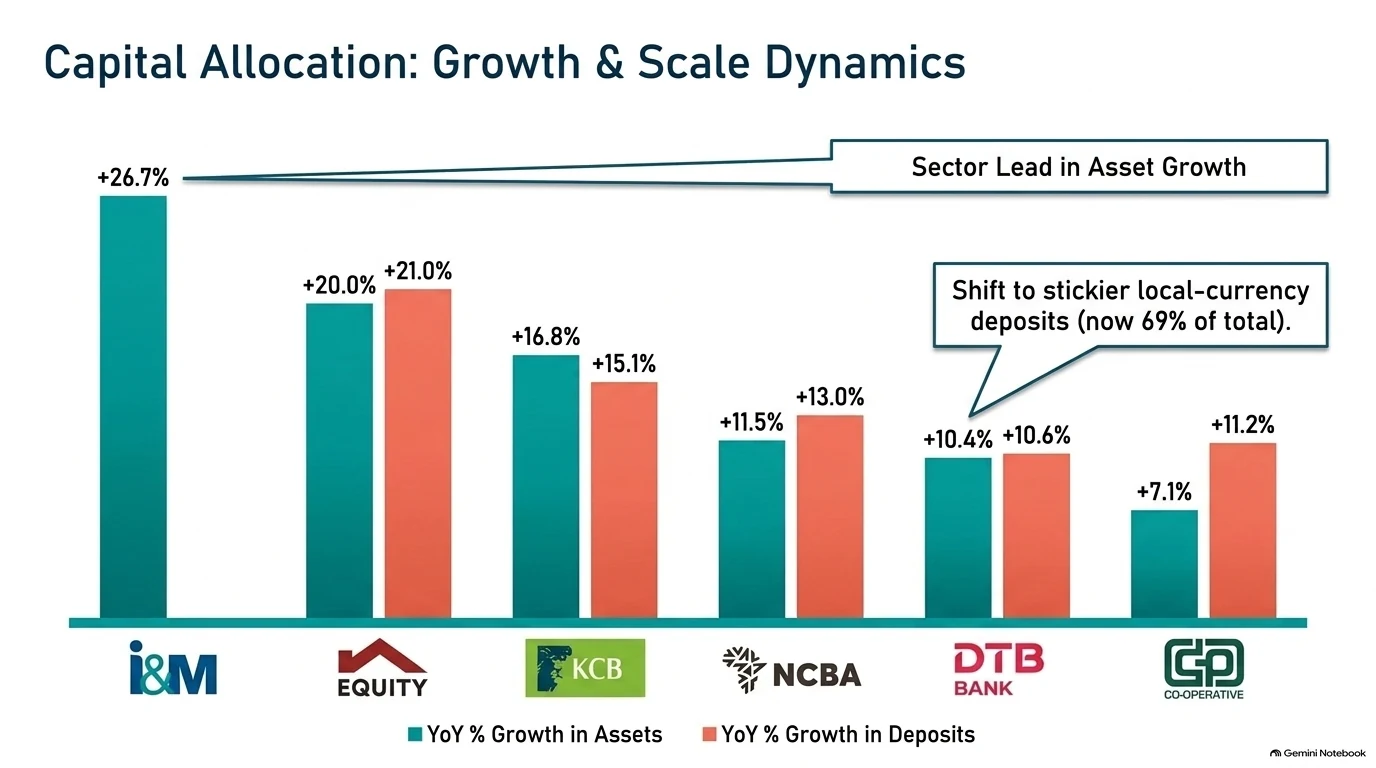
| Bank | Total assets | Asset growth | Deposits | Deposit growth |
|---|---|---|---|---|
| KCB Group | KES 2.30 Tn | +16.8% | KES 1.71 Tn | +15.1% |
| Equity Group | KES 2.16 Tn | +20.0% | KES 1.59 Tn | +21.0% |
| Co-operative Bank | KES 869.5 Bn | +7.1% | KES 623.2 Bn | +11.2% |
| I&M Group | KES 746.0 Bn | +26.7% | n/a | n/a |
| NCBA Group | KES 739.0 Bn | +11.5% | CASA 55% of deposits | CASA +13% |
| DTB Group | KES 675.09 Bn | +10.4% | KES 534.15 Bn | +10.6% |
On the lending side, Equity's net loans grew 19.0% to KES 981.0 billion, KCB's gross loans 14.2% to KES 1.30 trillion, Co-op's net loans 18.1% to KES 462.2 billion and NCBA's gross loans 20.0% to KES 382.0 billion. DTB's gross loans rose 15.0% to KES 357.6 billion (62% in shillings) and its loan-to-deposit ratio increased to 61.4% from 59.3%.
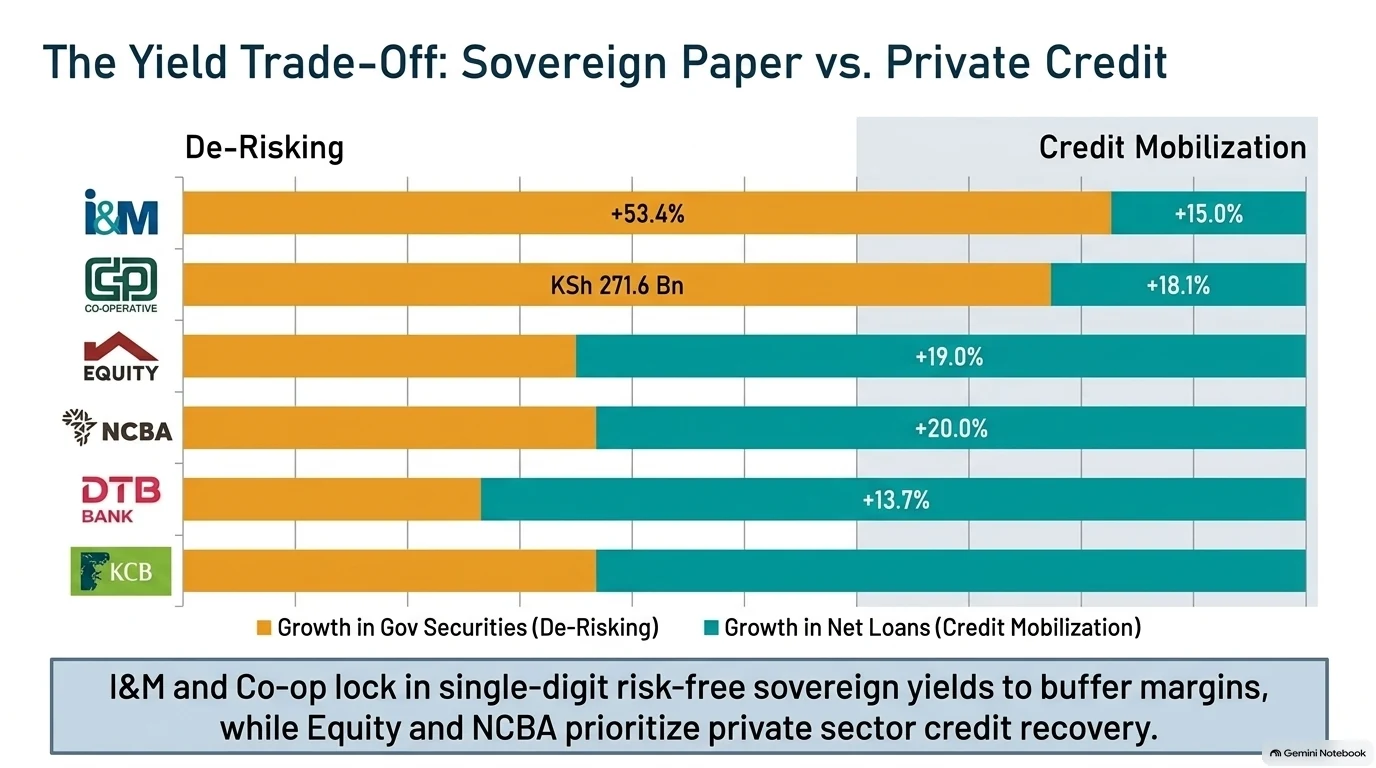
I&M's government securities holdings surged 53.4% to KES 204.0 billion, well ahead of its 15.0% net credit growth, and Co-op held KES 271.6 billion of government paper. Equity and NCBA tilted toward private-sector credit recovery.
Margins and non-funded income
Net interest income held up because banks cut their cost of funds. Three different engines did the work:
- DTB, liability optimisation: net interest margin up 20 bps to 6.8% (from 6.6%) as interest expense fell 23.2% to KES 12.23 billion and local-currency deposits rose to 69% of the total.
- NCBA, CASA expansion: margin up to 7.0% (from 6.6%); CASA deposits grew 13% to 55% of the total and cost of funds fell 110 bps to 4.1% (from 5.2%).
- Equity Bank Kenya, asset yield: domestic margin up 110 bps to 8.6% (from 7.5%), delivering a 34.7% domestic ROAE.
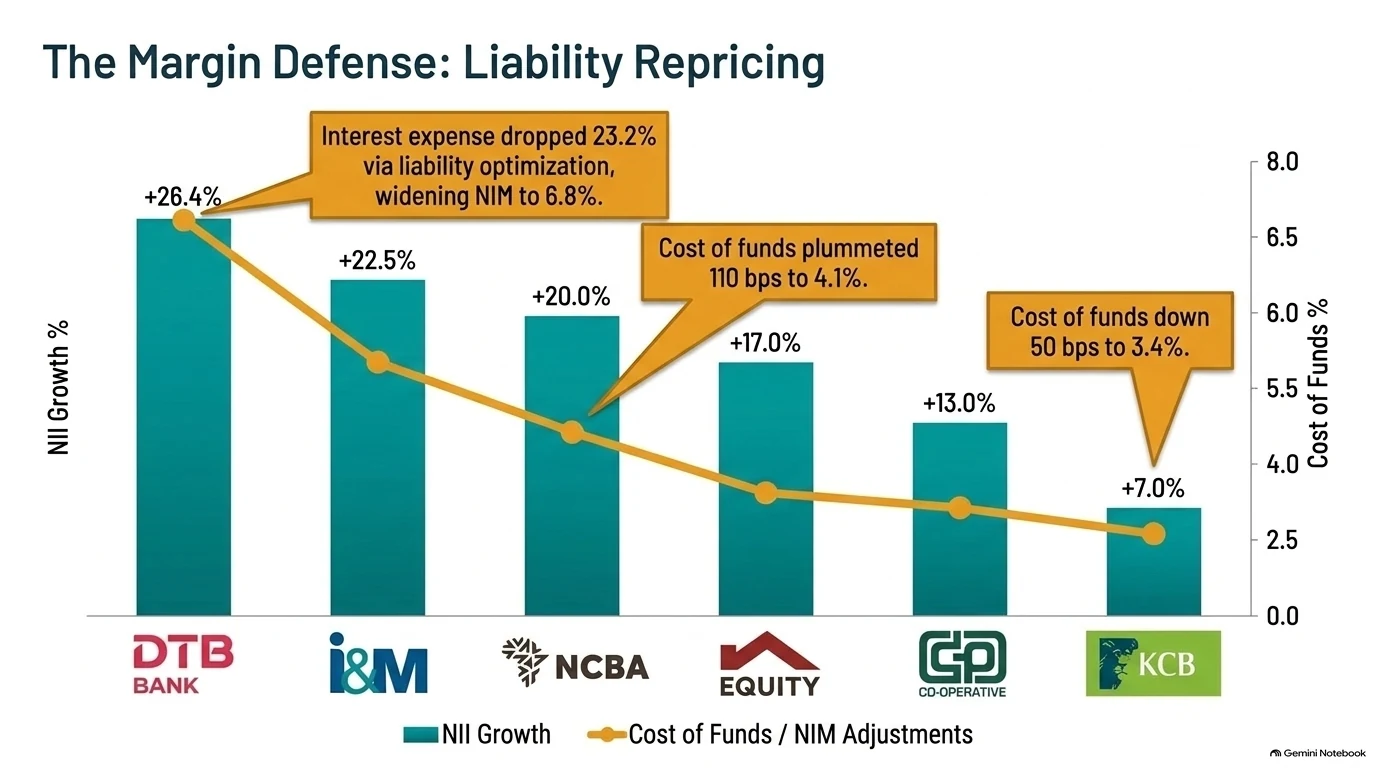
| Bank | NII growth | NII | Margin / funding cost |
|---|---|---|---|
| DTB Group | +26.4% | KES 20.04 Bn | NIM 6.8% (from 6.6%) |
| I&M Group | +22.5% | KES 25.0 Bn | NIM 8.7% (from 8.8%) |
| NCBA Group | +20.0% | KES 25.1 Bn | NIM 7.0% (from 6.6%); cost of funds 4.1% (from 5.2%) |
| Equity Group | +17.0% | KES 69.3 Bn | Kenya NIM 8.6% (from 7.5%) |
| Co-operative Bank | +13.0% | KES 33.2 Bn | n/a |
| KCB Group | Funded income +7.0% | n/a | Cost of funds 3.4% (from 3.9%) |
Non-funded income (NFI)
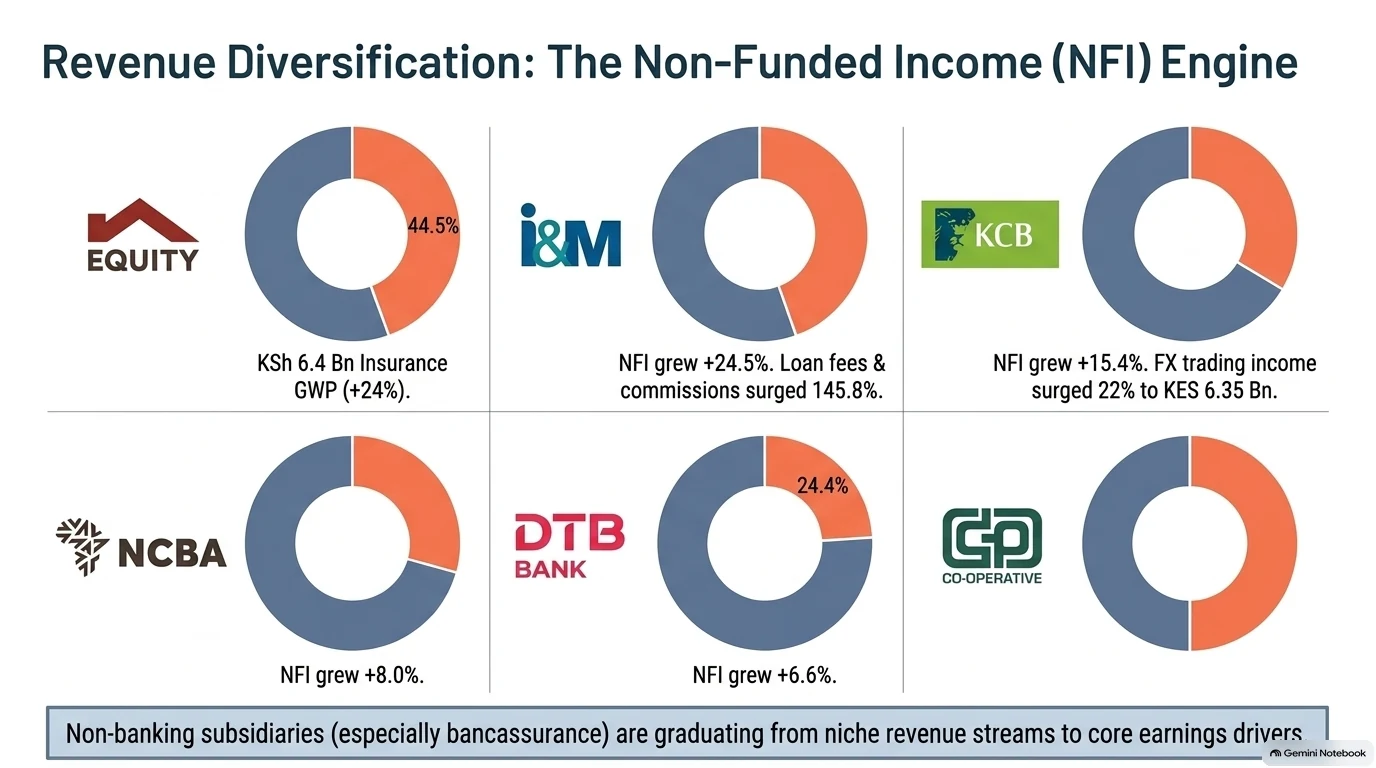
Fees, FX trading and insurance accelerated total income. Equity's NFI rose 36.0% to KES 55.6 billion (44.5% of group income). KCB's grew 15.4% on FX trading and loan fees (+30.0%). I&M's rose 24.5% as loan fees jumped 145.8% and FX trading gained 18.2%. NCBA's rose 8.0%, and DTB's 6.6% to KES 6.47 billion (24.4% of income). Co-op's derived NFI was KES 15.7 billion (total operating income of KES 48.9 billion less net interest income of KES 33.2 billion).
Asset quality: NPL ratios and provisioning strategies
Against an industry gross NPL ratio of 15.3% in May 2026, every Tier-1 bank was at or below the benchmark.
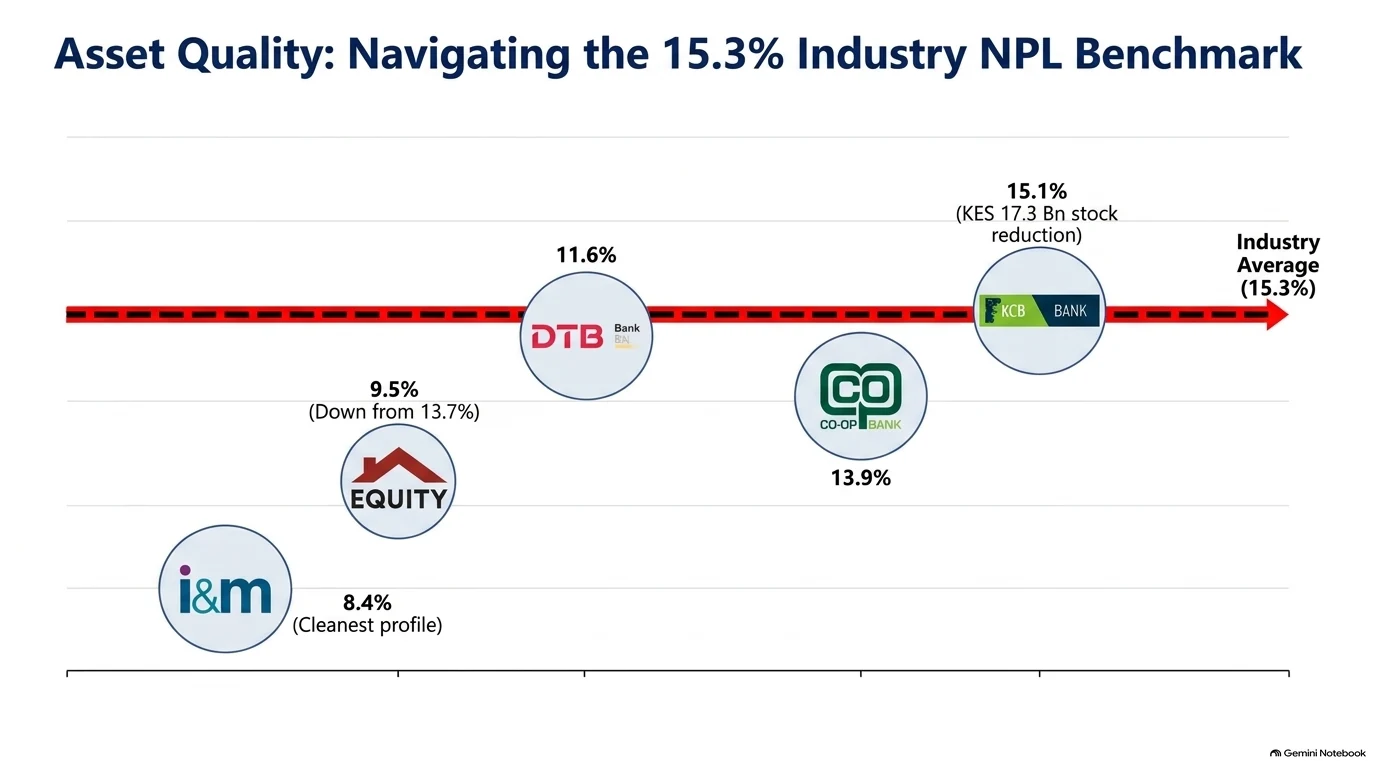
| Bank | NPL ratio | Previous | Notes |
|---|---|---|---|
| I&M Group | 8.4% | 11.0% | Gross NPLs −12.0% to KES 30.1 Bn; partly interest-in-suspense adjustments d |
| Equity Group | 9.5% | 13.7% | Predictive underwriting analytics, regional diversification |
| DTB Group | 11.6% | 13.0% | Stage 3 NPLs about KES 41.0 Bn (from KES 40.0 Bn) |
| Co-operative Bank | 13.9% | 17.2% | Recovery programmes across corporate and co-operative books |
| KCB Group | 15.1% | 18.7% | NPL stock down KES 17.3 Bn |
d I&M's ratio is 8.4% per broker notes; an alternative source puts it near 9%.
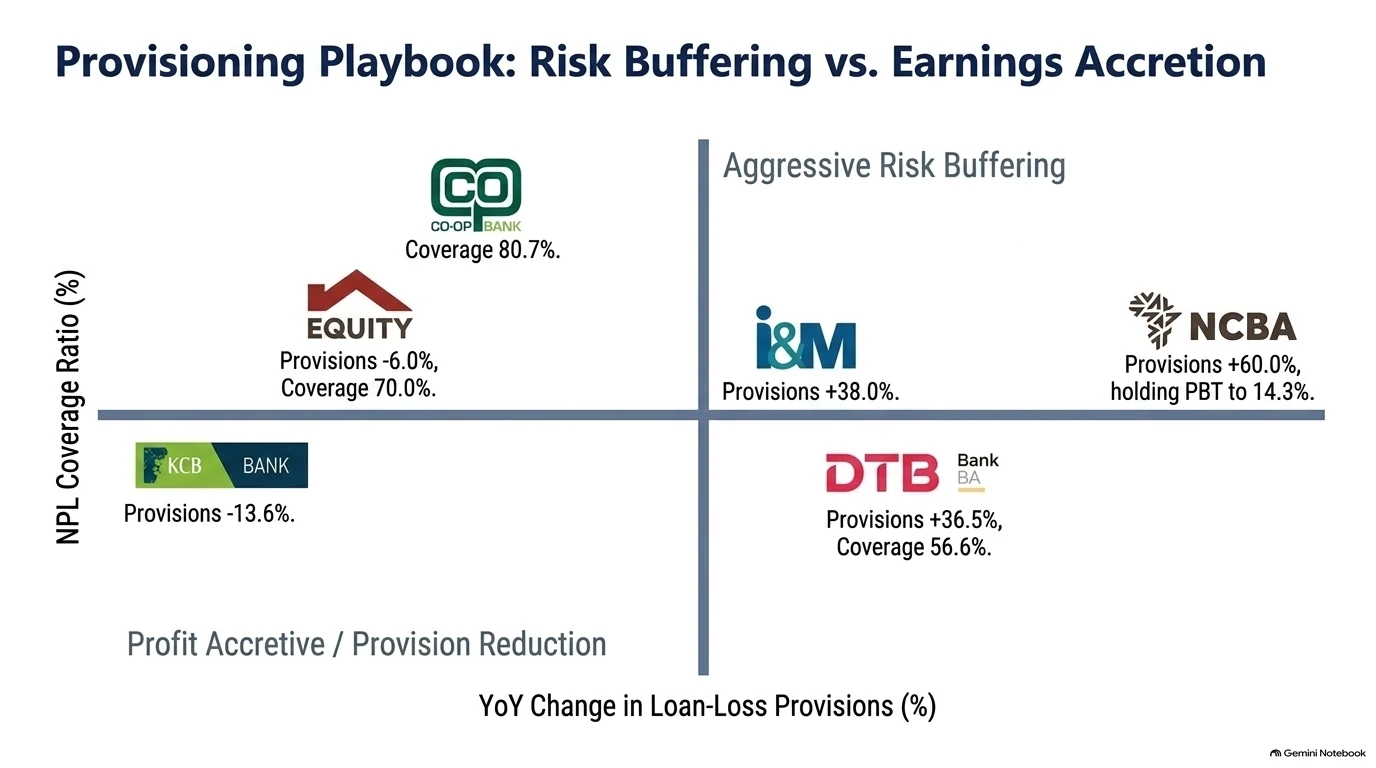
Divergent provisioning: earnings-accretive cuts versus pre-deal de-risking
| Bank | Strategy | Provisions | Cost of risk / coverage |
|---|---|---|---|
| KCB Group | Earnings-accretive | −13.6% to KES 10.8 Bn (from KES 12.5 Bn) | n/a |
| Equity Group | Earnings-accretive | −6.0% to KES 6.5 Bn | Cost of risk 1.4% (from 1.7%); coverage 70.0% (from 68.0%) |
| Co-operative Bank | Earnings-accretive | n/a | Cost of risk 1.8% (from 2.4%); IFRS coverage 80.7% (from 69.9%) |
| NCBA Group | Pre-deal de-risking | +60.0% to KES 5.2 Bn (from KES 3.2 Bn) | n/a |
| DTB Group | Risk buffering | +36.5% to KES 4.43 Bn | Cost of risk 2.7% (from 2.3%); specific coverage 56.6% (from 40.7%) |
| I&M Group | Risk buffering | Impairments +38.0% (Kenya +34.0%) | n/a |
Banks with high legacy buffers (KCB, Equity, Co-op) cut charges, which directly lifted pre-tax earnings. NCBA front-loaded provisions to present a clean book to Nedbank, while DTB and I&M built coverage as their balance sheets grew.
Regional subsidiaries: the growth engines
Cross-border units across the EAC insulated group performance from a plateau in domestic earnings.
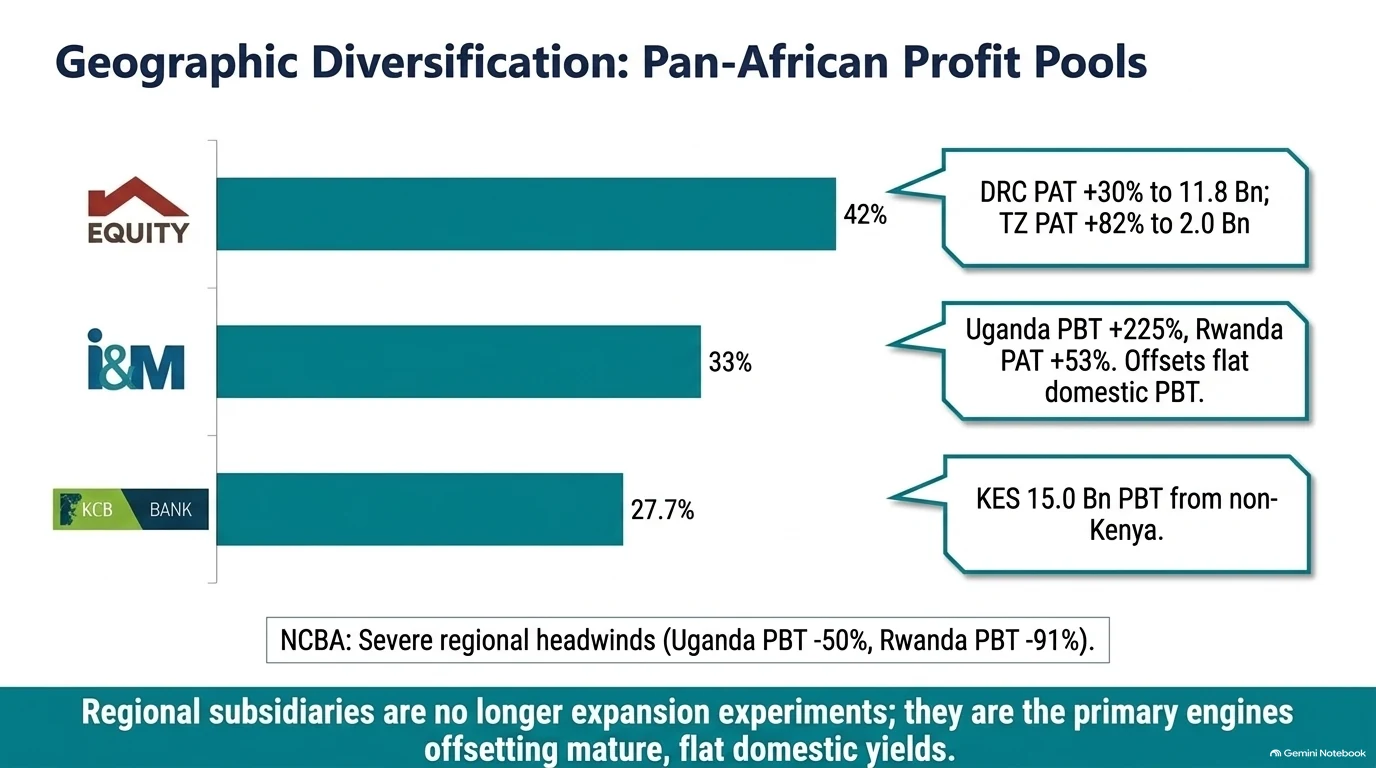
- Equity Group: non-Kenya banking subsidiaries contributed 42% of group profit after tax, 47% of banking revenue, 54% of net loans, 51% of deposits and 52% of banking assets. DRC (Equity BCDC) PAT rose 30.0% to KES 11.8 billion, Tanzania's 82.0% to KES 2.0 billion and Rwanda's 12.0% to KES 2.9 billion.
- KCB Group: regional subsidiaries generated KES 15.0 billion of pre-tax profit (+10.0%), about 28% of group PBT, and 31.1% of total assets are outside Kenya.
- I&M Group: regional units supplied 33% of group PBT (from 25%), offsetting flat Kenya PBT of KES 8.3 billion. Rwanda's balance sheet grew 44.0% to KES 118.0 billion with PAT up 53.0%; Uganda's PBT surged 225.0%.
- NCBA Group: Tanzania PBT rose 57.0%, but Uganda fell 50.0% and Rwanda 91.0% on margin squeeze and lower recoveries. Its Ghana fintech expansion posted a KES 28.0 million pre-tax loss.
- DTB Group: its "DTB 3.0" plan targets 100 branches in Kenya and 163 across East Africa by December 2026.
Digital banking and operational efficiency
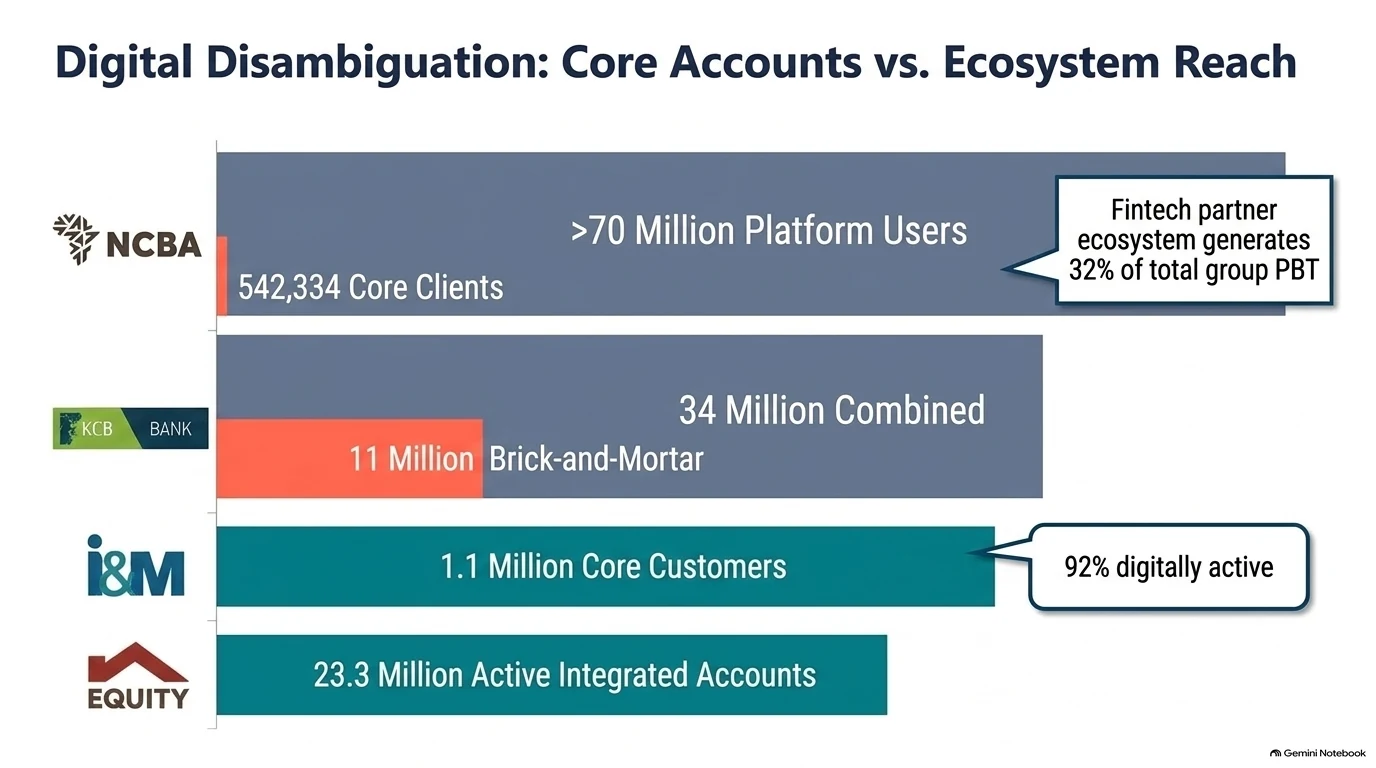
Customer counts are not like-for-like. Always separate core account holders from ecosystem users.
| Bank | Core accounts | Digital / ecosystem | What the number means |
|---|---|---|---|
| NCBA Group | 542,334 core clients (+20%) | 70 million+ platform users | Headline figure reflects telco partner platforms (Fuliza, M-Shwari, MoKash, M-Pawa); Kenya core clients are 496,000 |
| KCB Group | 11.0 million brick-and-mortar | 23.0 million digital accounts | 34.0 million combined |
| Equity Group | 23.3 million active accounts | Multi-channel | Active integrated accounts across mobile, Equitel, EazzyBiz and agents |
| DTB Group | 5.9 million clients (+44%) | 5.0 million digital | 99% of new clients onboarded digitally |
| I&M Group | 1.1 million core clients (+20%) | 92% digitally active | Via On-The-Go platform |
| Co-operative Bank | 10.0 million+ accounts | Members, retail, MSMEs | Over 90% of transactions off-branch |
Digital scale
- KCB: KES 314.0 billion in mobile loans (+25.0%, about KES 1.7 billion a day); 99% of transaction volume off-branch.
- Equity: 98.3% of transactions off-branch (89.7% digital). 82% of staff completed Generative AI training, 5,743 earned Huawei ICT certifications (119,980 hours) and 406 are enrolled in WorldQuant University master's programmes.
- I&M: KES 15.7 billion disbursed via On-The-Go; digital revenue is 21.7% of retail and business banking income.
- Co-operative Bank: over 90% of transactions through alternative channels; KES 27.0 billion disbursed to more than 500,000 youth entrepreneurs.
- DTB: 86% of transactions off-branch and KES 10.0 billion of digital credit; preparing robotic process automation (RPA) and agentic AI for back-office work.
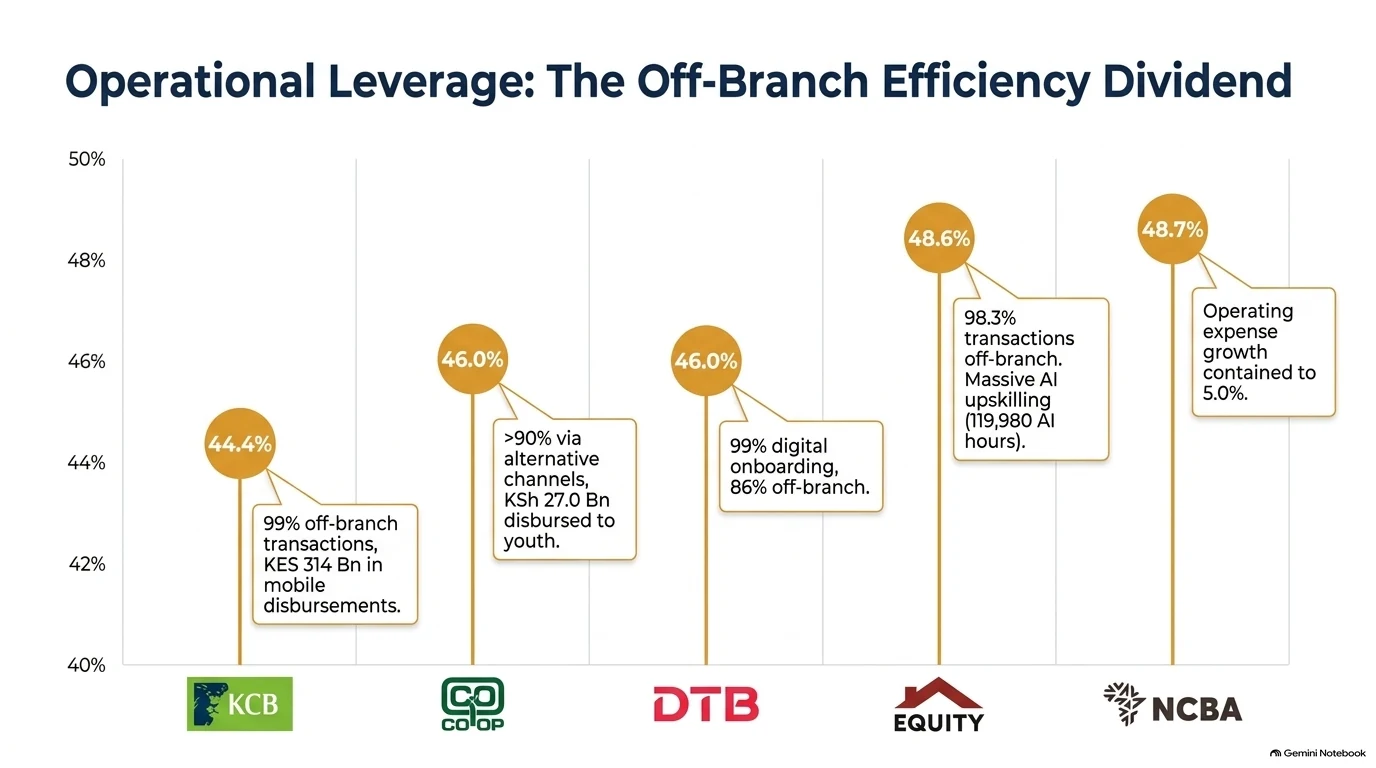
Cost-to-income ratios
| Bank | H1 2026 | Previous |
|---|---|---|
| KCB Group | 44.4% | 46.0% |
| DTB Group | 46.0% | 52.4% (−640 bps) |
| Co-operative Bank (before provisions) | 46.0% | held |
| Equity Group | 48.6% | 51.7% |
| NCBA Group | 48.7% | 52.5% |
DTB held operating expense growth to 5.9% against a 20.9% rise in gross operating income, a textbook case of positive operating leverage.
Are Kenyan banks safe and well capitalised?
Tier-1 balance sheets sat well above CBK minimums in H1 2026.
- Co-operative Bank: total capital to risk-weighted assets of 22.9% (statutory minimum 14.5%) and a liquidity ratio of 57.3% (minimum 20.0%).
- Equity Group: shareholders' funds up 27.0% to KES 350.0 billion, supporting a 26.5% ROAE and 4.5% ROAA.
Regional diversification adds a further buffer. Cross-border earnings help insulate groups from a single-market downturn, though they bring currency and political risk of their own.
M&A, strategic outlook and the second half
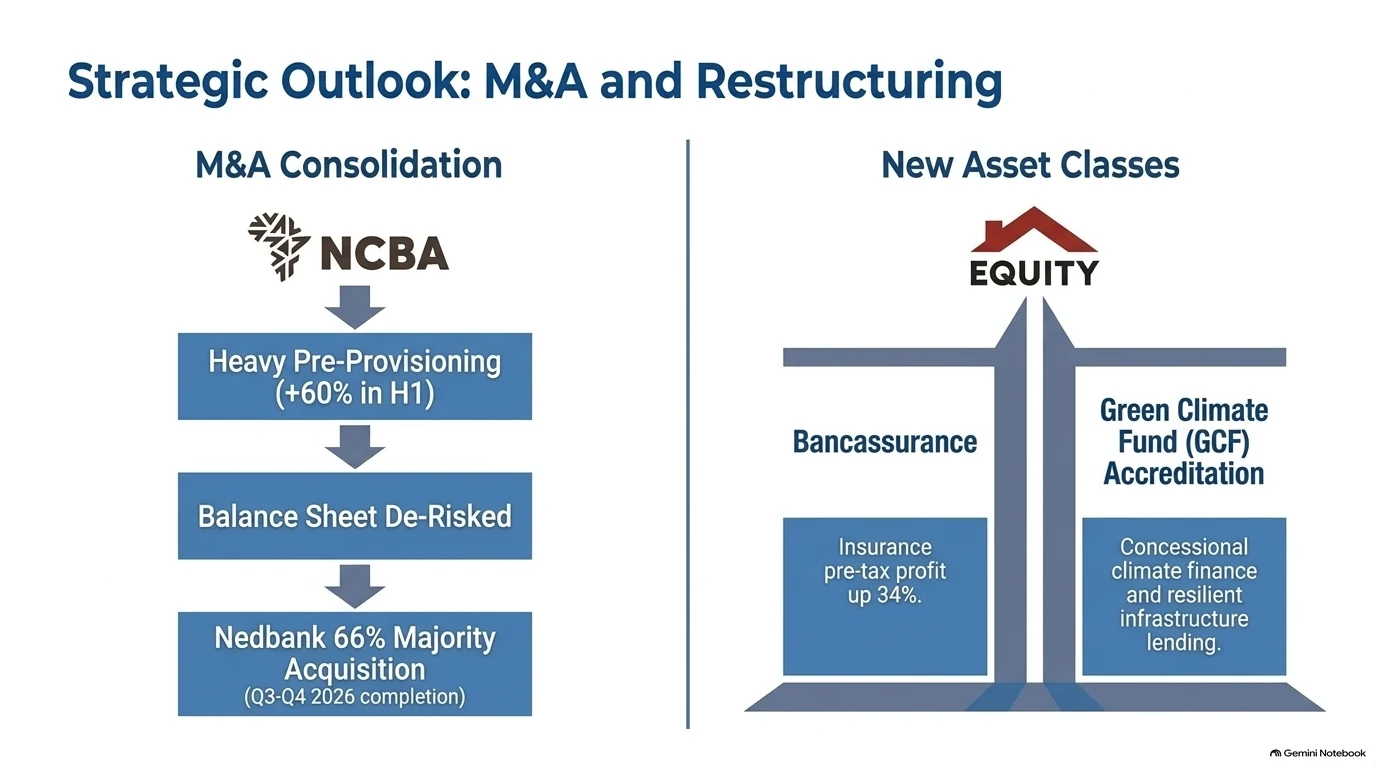
- Nedbank and NCBA: South Africa's Nedbank Group received CBK approval to acquire up to a 66% stake in NCBA Group PLC, with completion targeted for Q3–Q4 2026. NCBA's 60% provision build to KES 5.2 billion reads as a de-risking move ahead of integration.
- Equity and climate finance: Equity achieved Direct Access Entity accreditation from the Green Climate Fund (GCF), opening concessional and blended funding for green enterprise credit, climate-smart agriculture and resilient infrastructure under its Africa Recovery and Resilience Plan.
- Bancassurance: Equity Insurance's KES 1.25 billion pre-tax profit (+34.0%) shows non-banking lines graduating into core earnings drivers.
Key risks for H2 2026 are non-core inflation spikes, asset-quality pressure in domestic SME segments, tax-rate changes and regional margin compression (NCBA's Uganda and Rwanda are the example).
Strategic archetypes at a glance
Key banking ratios explained in plain English
- Non-performing loan (NPL) ratio
- The share of a bank's loan book in default or near-default (typically 90 days or more unpaid). Formula: gross NPLs ÷ gross total loans × 100. Lower means better portfolio quality.
- Return on average equity (ROE / ROAE)
- How well management turns shareholders' capital into profit. Formula: net profit ÷ average shareholders' equity × 100. Equity Group's 26.5% is the example here.
- Return on average assets (ROA / ROAA)
- How efficiently the whole asset base (loans, cash, bonds) generates profit. Formula: net profit ÷ average total assets × 100. Equity Group's was 4.5%.
- Cost-to-income ratio (CIR)
- Operating costs as a share of operating income. Formula: operating expenses (excluding provisions) ÷ total operating income × 100. KCB's 44.4% was the lowest in Tier-1.
- Capital adequacy ratio (CAR)
- A regulatory buffer: available capital as a share of risk-weighted assets. Formula: (Tier 1 + Tier 2 capital) ÷ risk-weighted assets × 100. Co-op's 22.9% compares with a 14.5% minimum.
- Provision coverage and cost of risk
- Coverage is the share of bad loans backed by IFRS 9 provisions (accumulated provisions ÷ gross NPLs × 100). Cost of risk is the annual impairment charge as a share of loans (annualised impairment charge ÷ average gross loans × 100). Co-op's coverage is 80.7%.
Investor checklist and executive guidance
When reading East African bank disclosures, check four things:
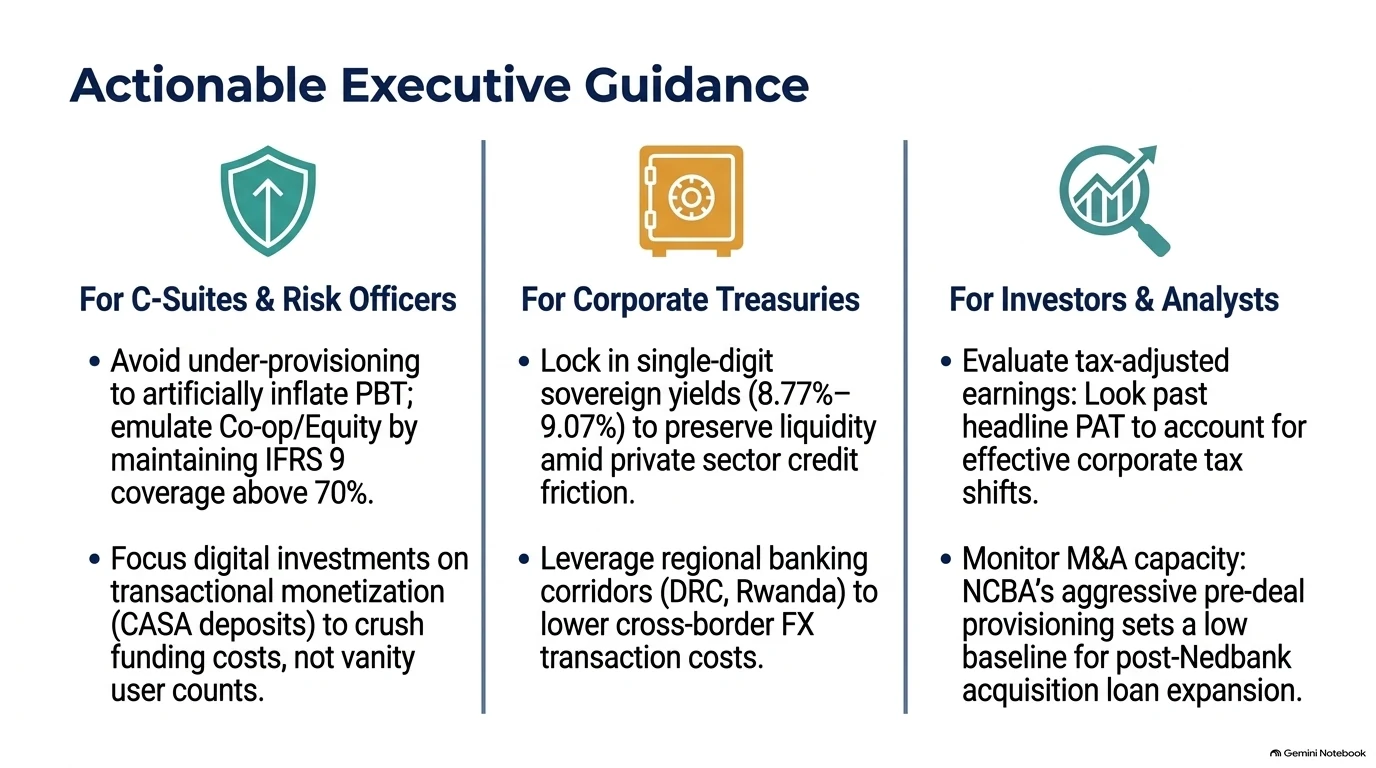
- Tax-adjusted versus operational growth. Check whether profit after tax growth comes from operations or a tax-rate change (I&M's PAT +22.0% helped by a drop from 29.0% to 24.5%; KCB's PAT +14.0% lagged its 20.8% PBT growth on a 46% tax-charge jump).
- Provisioning discipline versus NPL reality. Ask whether lower provisioning reflects genuine recovery or earnings management, and whether IFRS 9 coverage stays above 70% (Co-op 80.7%, Equity 70.0%).
- Core deposits versus vanity metrics. Separate headline user numbers from core account holders, and favour banks growing low-cost CASA deposits (NCBA at 55%).
- Regional FX and political risk. Track regional share of group profit and confirm high-margin units such as Equity BCDC (KES 11.8 billion PAT) pay for the currency and political risk.
Frequently asked questions
How did Kenyan banks perform in H1 2026?
Kenya's 12 listed commercial lenders generated KES 159.5 billion in aggregate post-tax profits in H1 2026. Performance was driven by non-funded income expansion, off-branch digital transaction migration, lower deposit funding costs and regional subsidiary contributions across the East African Community.
Which Kenyan bank made the highest profit in H1 2026?
Equity Group Holdings recorded the highest post-tax profit among Kenyan banks in H1 2026, at KES 45.5 billion after tax and KES 57.8 billion before tax. KCB Group ranked second with KES 36.9 billion post-tax profit and KES 52.8 billion pre-tax profit.
Which bank has the largest balance sheet in Kenya?
KCB Group has the largest balance sheet, with total assets up 16.8% year on year to KES 2.30 trillion. Equity Group follows at KES 2.16 trillion.
Why are Kenyan banks profitable despite economic headwinds?
Tier-1 banks diversify into non-funded income (FX trading, digital fees, insurance underwriting), move over 90% of transactions to low-cost digital channels, allocate liquidity to sovereign paper yielding 8.77%–9.07%, and earn up to 42% of profits from faster-growing regional subsidiaries in the DRC, Rwanda and Uganda.
What is the average NPL ratio for Kenyan banks in 2026?
The industry average gross non-performing loan (NPL) ratio stood at 15.3% in May 2026. Tier-1 lenders outperformed it: I&M Group 8.4%, Equity Group 9.5%, DTB Group 11.6%, Co-operative Bank 13.9% and KCB Group 15.1%.
Which Tier-1 bank had the lowest NPL ratio in H1 2026?
I&M Group had the lowest gross NPL ratio among Tier-1 banks at 8.4%, down from 11.0% in H1 2025, partly helped by interest-in-suspense accounting adjustments.
Is asset quality improving in Kenya's banking sector?
Yes, at the Tier-1 level. Equity cut its NPL ratio to 9.5% (from 13.7%), I&M to 8.4% (from 11.0%), Co-operative Bank to 13.9% (from 17.2%) and KCB to 15.1% (from 18.7%), with KCB's NPL stock falling by KES 17.3 billion.
What is ROE and why does it matter to bank investors?
Return on average equity (ROAE) measures how efficiently a bank turns shareholders' capital into net profit. Equity Group delivered a 26.5% ROAE in H1 2026, supported by a 34.7% annualised domestic ROAE at Equity Bank Kenya.
Which bank was the most efficient in H1 2026?
KCB Group had the lowest cost-to-income ratio among Tier-1 peers at 44.4% (down from 46.0%). DTB Group and Co-operative Bank each recorded 46.0%.
What major M&A deal involves NCBA Group in 2026?
South Africa's Nedbank Group received Central Bank of Kenya approval to acquire up to a 66% majority stake in NCBA Group PLC, with completion targeted for Q3–Q4 2026.
How much did KCB disburse in mobile loans in H1 2026?
KCB Group disbursed KES 314.0 billion in mobile loans in H1 2026, up 25.0% year on year and averaging about KES 1.7 billion a day.
What was Co-operative Bank's capital adequacy ratio in H1 2026?
Co-operative Bank reported a total capital-to-risk-weighted-assets ratio of 22.9% against a 14.5% statutory minimum, and a liquidity ratio of 57.3% against a 20.0% minimum.
What was the 91-day Treasury bill yield in Kenya?
At the latest auction covered in this analysis, the 91-day Treasury bill yield was 8.77%, with 182-day paper at 8.93% and 364-day paper at 9.07%.
Will bank profits remain strong in the second half of 2026?
The outlook is favourable, supported by regional growth (DRC 5.6%, Uganda 6.4%, Rwanda 6.8%), expanding digital lending and de-risked balance sheets. Performance will still depend on non-core inflation, tax policy changes and credit workout discipline.
Sources, methodology and disclaimer
Source: primary intelligence briefing "H1 2026 Kenya Tier-1 Banking Sector Analysis: Balance Sheet Resilience, Regional Expansion, and Digital Disambiguation". Data covers the six months ended 30 June 2026, with macroeconomic context updated through August 2026.
Data limitations
- KCB country breakdowns. The interim summaries omit country-level pre-tax profit for the DRC (Trust Merchant Bank), Rwanda, Burundi and Ethiopia, giving only an aggregate regional figure of KES 15.0 billion (KES 9.52 billion in alternative press statements).
- I&M NPL adjustment. Part of the fall in I&M's NPL ratio to 8.4% came from interest-in-suspense accounting adjustments, not recoveries alone.
- Customer metrics. NCBA's 70 million-plus headline includes telco partner accounts; its core direct clients total 542,334.
- Gaps. Return metrics (ROE/ROA) are available for Equity only, and total deposits are not specified for I&M.
Disclaimer: This article is published for educational, informational and news purposes only. The metrics, ratios and commentary do not constitute investment, tax, legal or financial advice. Consult a licensed financial adviser before making decisions about listed securities.
Join the discussion
Please do not share account numbers, phone numbers, links or other personal details. Comments are general discussion, not advice. All comments are reviewed before they appear, and we may remove comments that break these rules.